US TREASURY HOLDINGS & GLOBAL CAPITAL FLOWS
5-Year Analysis (2021–2026): The De-Dollarization Paradox
Published by The Retail Trader · JAN 27, 2026 · Global Macro
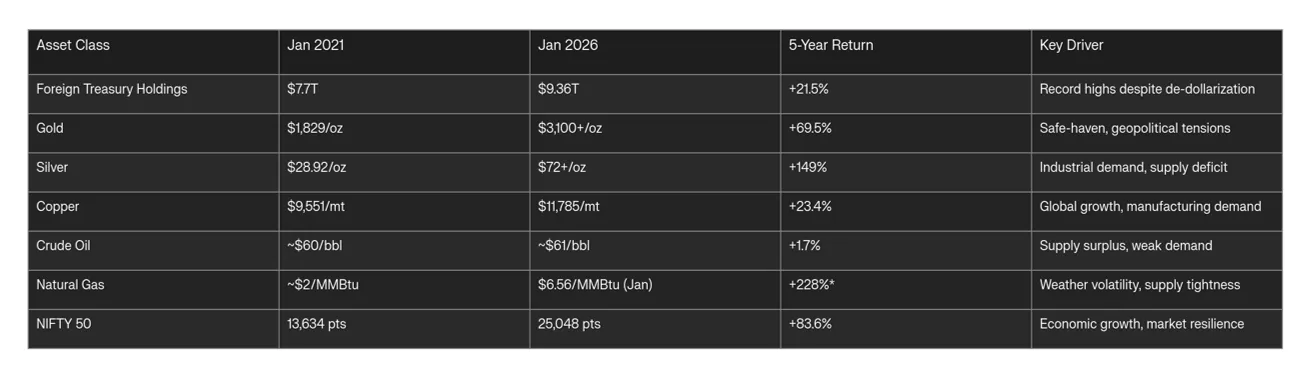
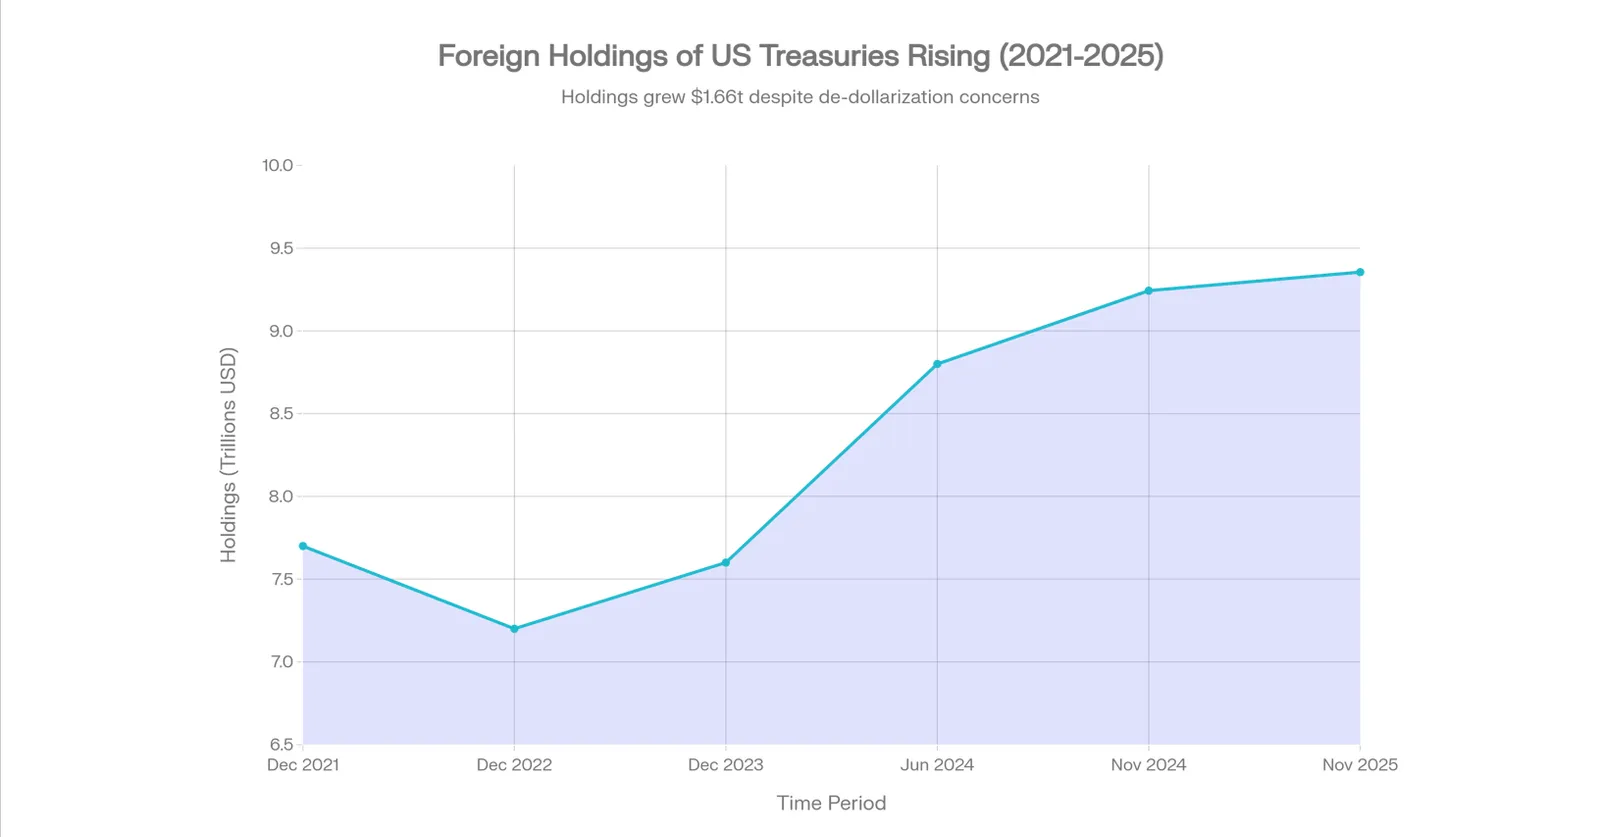
Over the past five years, US Treasury holdings have reached unprecedented levels globally, climbing from $7.7 trillion in December 2021 to a record $9.36 trillion in November 2025—a 21.5% increase. This paradoxical development unfolds against a backdrop of accelerating de-dollarization, where major economies including China, Brazil and India have reduced their Treasury exposure by 10–26%, redirecting capital toward gold and non-dollar assets.
Simultaneously, commodity markets have undergone dramatic divergence: precious metals—particularly silver and gold—have shown significant upward movement, while crude oil has stagnated. India's NIFTY 50 has demonstrated long-term growth trends, demonstrating the relative attractiveness of equities within a transforming macroeconomic landscape.
US Treasury Holdings: The Paradox of Record Inflows Amid De-Dollarization
The Bifurcated Flow Story
Foreign holdings of US Treasury securities tell a complex story of divergent capital movements. While aggregate holdings have climbed to a historic peak of $9.36 trillion in November 2025, this aggregate masks profound compositional shifts that signal growing skepticism about dollar hegemony among major reserve holders.
Historical Trajectory:
• December 2021: $7.7 trillion
• December 2023: $7.6 trillion
• November 2024: $9.24 trillion
• November 2025: $9.36 trillion (record high)
The spike in 2024–2025 reflects not a reversal of de-dollarization but rather an acceleration of what economists term the "bifurcated global order." Japan, the United Kingdom, Belgium, and Canada have increased holdings substantially, while the world's three largest central banks—China, India, and Brazil—have systematically divested.
Major Holders and Strategic Reallocation
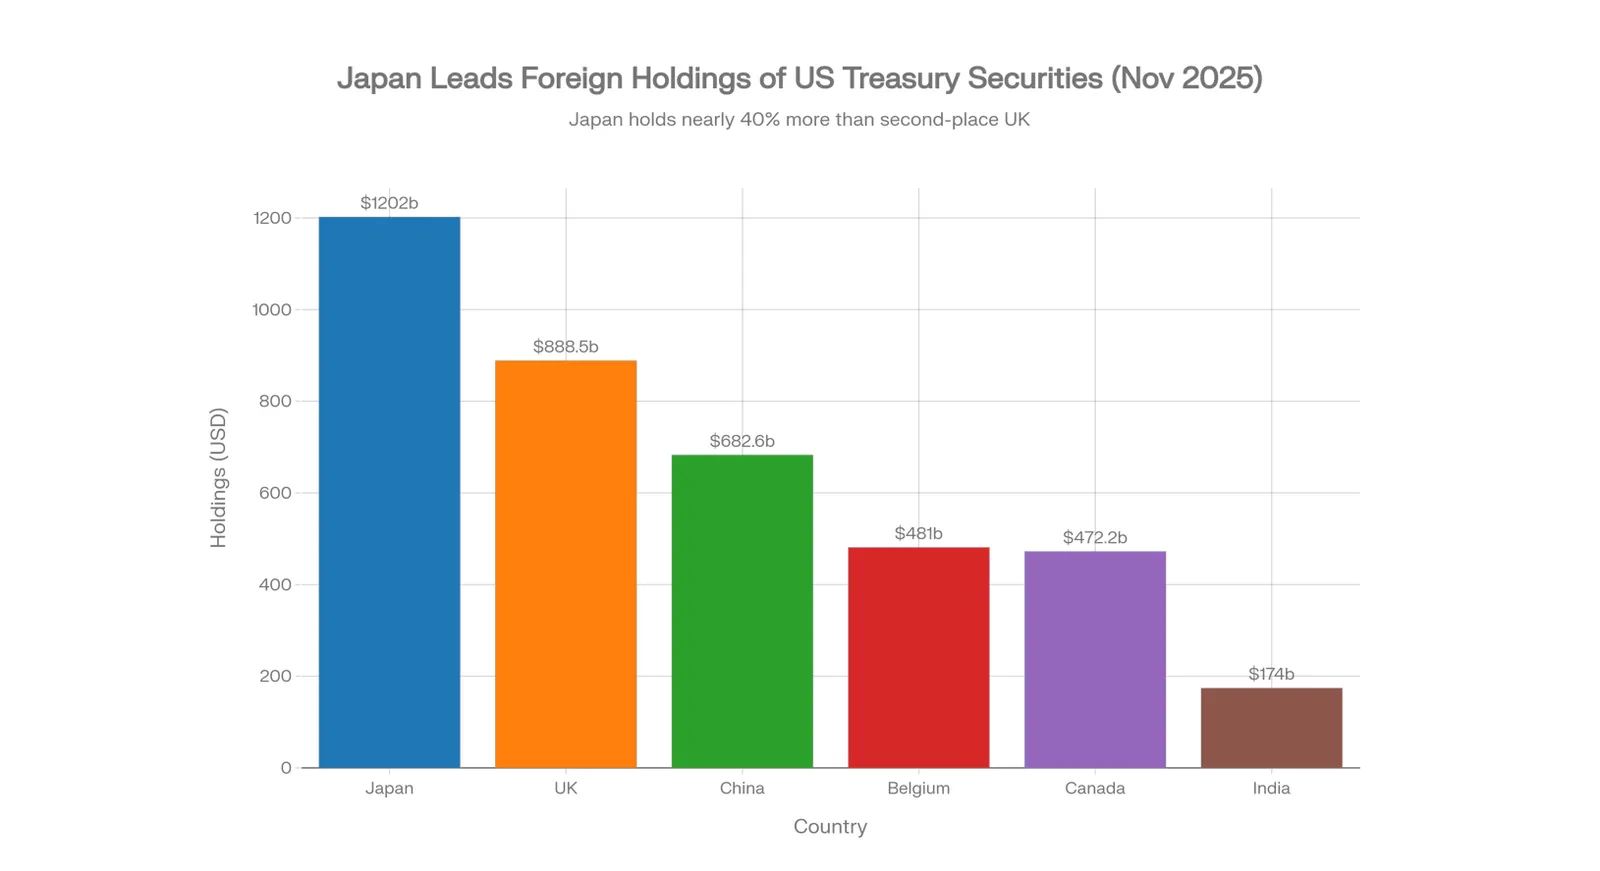
Japan remains the largest foreign holder with $1.202 trillion as of November 2025, having increased its position modestly from prior years. The United Kingdom holds $888.5 billion, placing it second among traditional reserve holders. China, despite being the second-largest economy globally, has reduced its Treasury holdings to $682.6 billion—the lowest level since 2008, representing a decline of nearly 10% in a single year.
India's de-dollarization has been particularly aggressive. The Reserve Bank of India (RBI) slashed US Treasury holdings from a 2023 peak of $234 billion to just $174 billion by November 2025—a 26% reduction executed deliberately to support the rupee and reduce vulnerability to sanctions, lessons drawn from the freezing of Russia's foreign exchange reserves in February 2022.
The Geopolitical Catalyst: Dollar Weaponization Concerns
The acceleration of de-dollarization directly traces to fears of dollar-based sanction regimes. When the United States froze Russia's $300+ billion in foreign exchange reserves following the Ukraine invasion in February 2022, it fundamentally altered the cost-benefit calculus of holding dollar-denominated assets globally. Central banks, particularly in Asia and the Global South, reassessed the safety premise underlying their Treasury portfolios.
The share of US dollars in global foreign exchange reserves has fallen to 58.5% in 2024 from 71% in 1999—a 30-year low. This reflects a deliberate, structural shift rather than cyclical adjustment. Brazil, India, and China have synchronized their selling, collectively divesting tens of billions of dollars in Treasuries while simultaneously accumulating physical gold and, in some cases, building bilateral settlement mechanisms in non-dollar currencies.
Commodity Price Dynamics: A Study in Divergent Trajectories
Gold: The Safe-Haven Renaissance
Gold prices have delivered a compelling narrative of monetary instability and geopolitical tension. The metal opened 2021 at $1,829 per ounce and surged to a historic peak of approximately $3,800+ in September 2025, representing a 108% gain over the period. The commodity maintained elevated levels into January 2026, trading above $3,100 per ounce.
Annual historical trends reflect the metal's role as an inflation and crisis hedge during times of economic shifts, banking stress, and geopolitical escalation.
The acceleration in 2024–2025 correlates precisely with central bank selling of Treasuries and renewed safe-haven demand amid tariff wars, geopolitical tensions, and Federal Reserve policy uncertainty. Gold's outperformance versus all other commodities and equities underscores its role as the ultimate monetary insurance policy in a multipolar world.
Silver: The Industrial-Monetary Supercycle
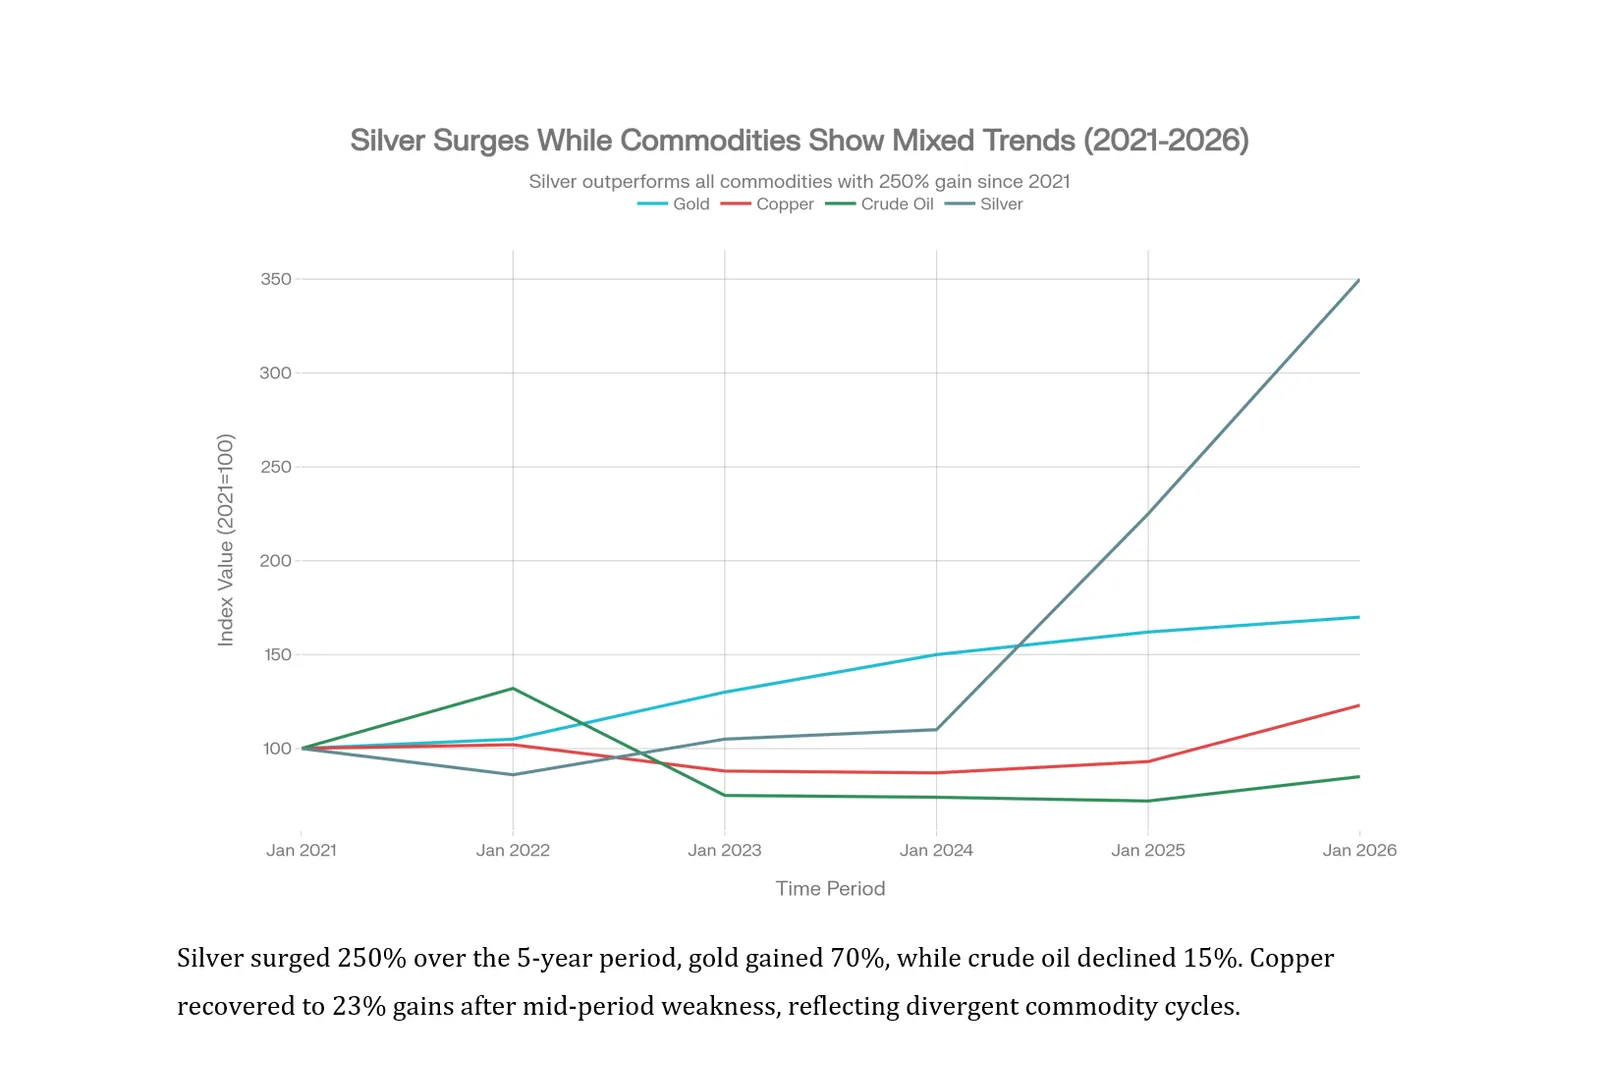
Silver's 5-year performance eclipses all major asset classes. The precious metal traded near $28.92 per ounce at the start of 2025 and surged to above $72 per ounce by year-end—a stunning 149% gain in a single year. Over the full 5-year period, silver has appreciated approximately 250%.
This exceptional performance reflects a convergence of structural drivers:
Structural Supply Deficit: Silver has operated in a multiyear supply deficit, with global demand exceeding mine production by an estimated 160–200 million ounces annually as of 2025. Inventories on the COMEX and LBMA have contracted sharply, reducing available physical bars and creating physical scarcity premiums.
Industrial Demand Explosion: Solar photovoltaic installations account for over 25% of global silver consumption and are projected to nearly double between 2020 and 2030. Electric vehicles demand approximately 20% more silver intensity than traditional vehicles, while data center buildouts driven by artificial intelligence infrastructure are creating new demand vectors.
The convergence of safe-haven buying (monetary instability) and industrial demand (energy transition) has created the rare environment of simultaneous investment and consumption demand strength. Unlike gold, which serves primarily as a monetary asset, silver commands both characteristics—a dynamic that has historically preceded significant price appreciation episodes.
Copper: Moderate Recovery Within Industrial Demand
Copper prices increased 23.4% over five years, rising from $9,551 per metric ton in January 2021 to $11,785 in December 2025. The metal exhibited greater volatility than precious metals, reflecting its sensitivity to global growth dynamics and manufacturing activity.
• January 2021: $9,551/mt
• December 2024: $8,916/mt (weakness amid China slowdown concerns)
• December 2025: $11,785/mt (+32.18% recovery in 12 months)
Copper's moderate outperformance relative to gold reflects its dual identity as industrial metal and inflation hedge. The recent 12-month surge of 32% suggests renewed optimism regarding global manufacturing and energy infrastructure buildout, partially offsetting persistent doubts about Chinese economic momentum.
Crude Oil: Energy Transition Headwinds
Crude oil has been the weakest performer among major commodities, showing stagnant long-term trends over the 5-year period. Brent crude traded near $60 per barrel in January 2026, slightly above 2021 levels despite intermediate volatility.
• 2021-2022: Sharp rally to $120+ driven by Russia-Ukraine supply shock
• 2023-2025: Persistent decline as supply grew faster than demand
• January 2026: $60.58/bbl, down 17.2% year-over-year
The Energy Information Administration forecasts Brent crude at $56/bbl in 2026, representing a 19% decline from 2025 averages. This forecast reflects structural headwinds: US and non-OPEC+ production is growing robustly, OPEC+ cut reversals are materializing, and demand growth remains constrained by energy transition dynamics. Crucially, the Trump administration's priority on energy supply expansion has counteracted geopolitical risk premiums that might otherwise support prices.
Natural Gas: Volatility and Winter Spikes
Natural gas has displayed extreme volatility, swinging from $15.78/MMBtu in December 2022 (energy crisis) to recent January 2026 levels of $6.56/MMBtu reflecting temporary weather shocks. On an annualized basis, natural gas has appreciated approximately 228% from baseline 2021 levels, but this metric is misleading given the 2022 spike and subsequent normalization.
The EIA forecasts an average of $3.50/MMBtu for 2026, implying a modest decline from 2025 levels. The commodity remains sensitive to weather volatility, LNG export capacity utilization, and production disruptions—creating episodic trading opportunities rather than directional conviction.
Commodity-Treasury Correlation: De-dollarization in Practice
A critical insight emerges from comparing Treasury de-dollarization with commodity price movements: central banks divesting Treasuries are simultaneously accumulating precious metals, particularly gold.
The RBI's Treasury reduction of 26% has been accompanied by an extended streak of gold purchases. China has sold Treasuries while ramping up gold accumulation for 14+ consecutive months. This synchronized pattern reveals the strategic architecture of de-dollarization: central banks are not merely losing confidence in dollar assets; they are explicitly reallocating to non-correlated, non-confiscatable assets that preserve real purchasing power independent of geopolitical sanction regimes.
The resulting commodity bull market—particularly in precious metals—reflects this forced reallocation as much as it reflects genuine supply-demand fundamentals. Gold's 70% appreciation and silver's 250% surge can be partially attributed to central bank accumulation programs that have become structurally embedded in reserve management strategies.
NIFTY 50 Performance: Equities in a Multipolar World
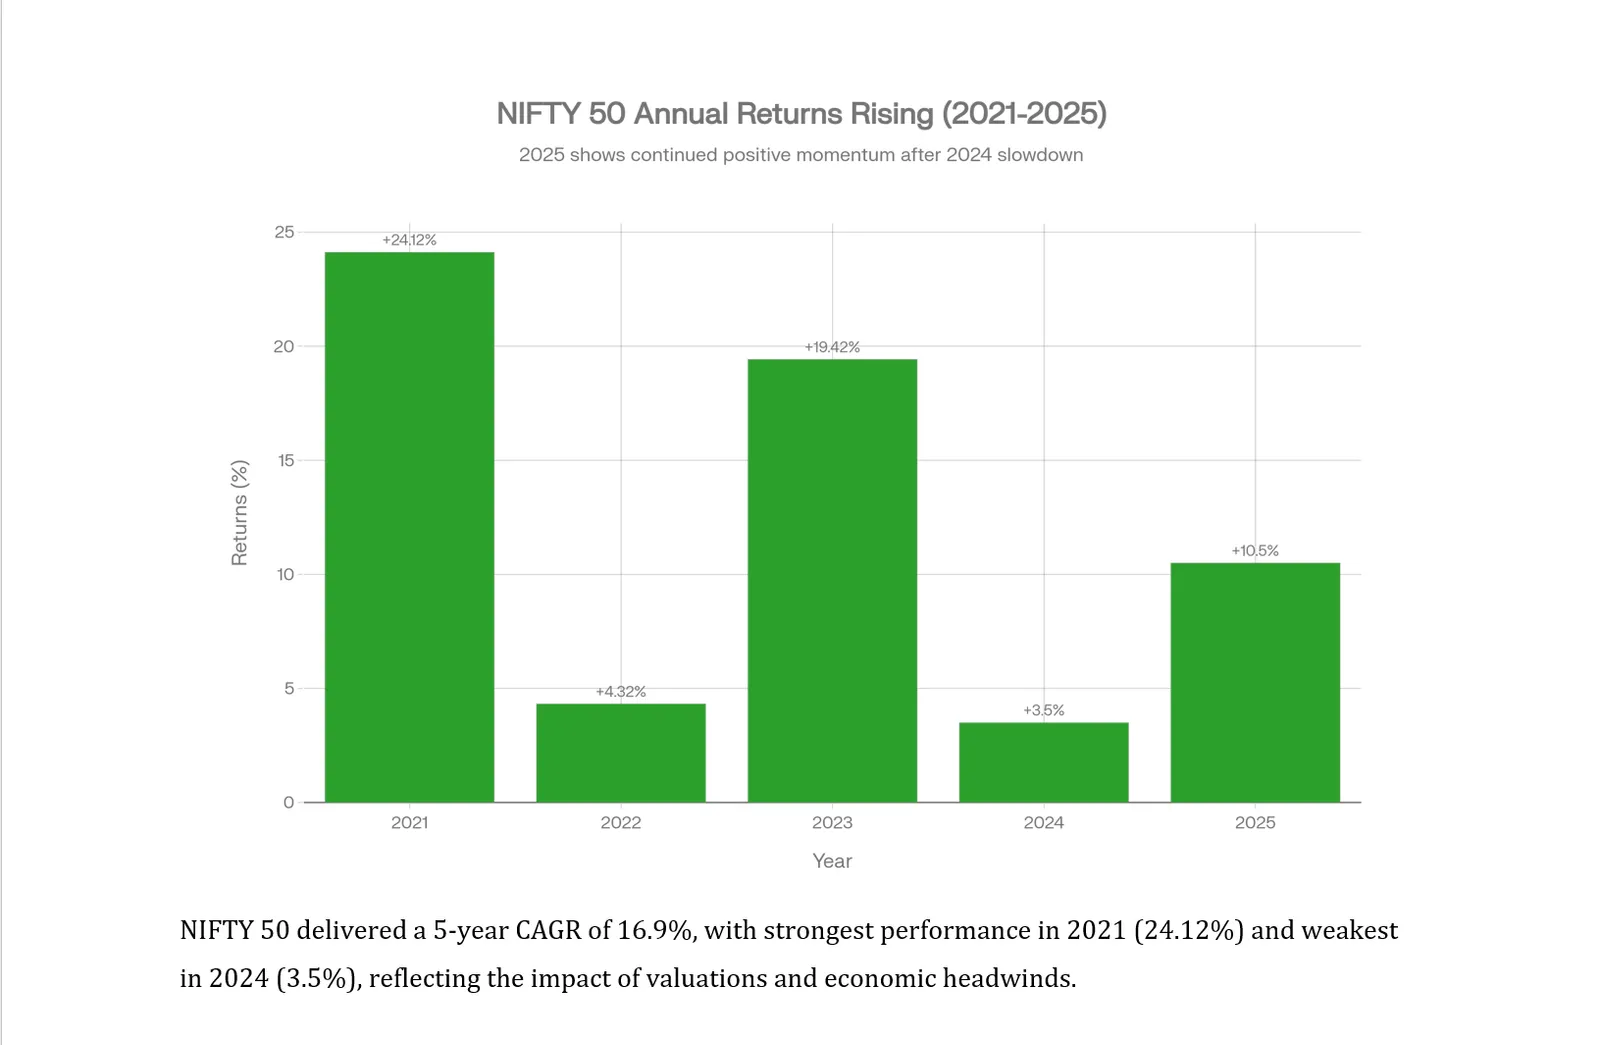
India's NIFTY 50 index has shown consistent long-term trends, with significant growth from January 2021 to January 2026. This performance places Indian equities in a strong position relative to broad historical commodity averages.
Annual Decomposition
The 5-year historical trends mask significant year-to-year volatility:
• 2021: Strong momentum – post-pandemic recovery, valuations still reasonable
• 2022: Flat momentum – Inflation shock, RBI tightening, modest moves amid global shifts
• 2023: Strong momentum – Recovery narrative, domestic growth resilience
• 2024: Weak momentum – reflecting elevated valuations, FII outflows, rupee weakness
• 2025: Moderate momentum – Stabilization following mid-cycle correction
Comparative Index Performance
Within Indian equities, concentration is evident. The NIFTY 50 historically showed different momentum patterns compared to broader market indices like the NIFTY Next 50 or NIFTY Smallcap 250. This divergence reflects periods of foreign institutional investor (FII) concentration in large-cap defensives, with mid-cap and small-cap segments facing pressure from valuation compression and interest rate dynamics.
Structural Headwinds and Tailwinds
Headwinds:
The Indian equity market faces material headwinds as of early 2026. The rupee has depreciated to record lows against the USD, exacerbating inflation concerns and prompting RBI intervention via Treasury sales. Rising US interest rates (relative to Indian rates) have triggered FII outflows, weighing on foreign-owned holdings. Valuations, while having compressed from 2024 extremes, remain elevated at a P/E of 21.76 and Price-to-Book of 3.41, limiting margin of safety.
The RBI's divestment of US Treasuries to defend the rupee represents a constrained policy choice: accumulating Treasuries would drain rupee liquidity and weaken the currency, necessitating the sale of reserves. This dynamic has contributed to India's Treasury reduction and will likely persist if geopolitical tensions or capital outflows accelerate.
Tailwinds:
Counterbalancing these headwinds is India's structural growth trajectory. The economy remains a rare example of 6%+ real growth in a world of synchronized deceleration. Domestic consumption remains resilient, and the government's capex trajectory supports infrastructure and employment. The financial sector—which comprises 36.84% of NIFTY 50 weightage—continues to generate deposits and credit growth.
Central Bank Behavior as Market Signal
The simultaneous dynamics of record Treasury holdings alongside aggressive de-dollarization by major holders transmit a clear message: the world is bifurcating into two reserve-holding strategies. Western central banks (Japan, UK, EU members) are accumulating Treasuries at a pace sufficient to drive aggregate records, while non-Western central banks (China, India, Russia-aligned nations, Brazil) are deliberately exiting Treasuries in favor of gold and bilateral arrangements.
This bifurcation reflects not temporary positioning but structural repositioning. The Bretton Woods-adjacent system of dollar dominance is eroding, replaced by parallel systems: BRICS+ settlements in national currencies, Chinese CIPS digital infrastructure, and renewed emphasis on commodity-backed arrangements. Central banks' Treasury sales and gold accumulation represent the advance guard of this transition.
Asset Allocation Implications
For investors navigating this environment, the data supports distinct conclusions:
Precious Metals (Gold & Silver): The continued strength reflects both de-dollarization and genuine supply constraints. Central bank accumulation is unlikely to reverse, providing a structural bid under prices. Silver's 250% appreciation, while extreme, has been accompanied by improving industrial supply-demand fundamentals rather than pure speculation. The case for precious metals is bifurcated: gold as monetary insurance; silver as industrial/energy transition play.
Crude Oil: The weak 5-year performance and bearish 2026 forecasts reflect structural supply surplus. Unless geopolitical disruptions (Middle East escalation, Russia sanctions intensification) materialize, crude oil is unlikely to sustain elevated prices. The Trump administration's focus on domestic oil production and relaxed permitting further weighs on prices.
Equities (NIFTY 50): Indian equities have maintained an overall upward historically-observable trajectory but experienced varying momentum relative to precious metals. Observing historical valuations can offer educational insight into potential margins of safety. India's structural growth story and demographic dividend remain a key focus for long-term economic studies.
Treasuries: Paradoxically, despite de-dollarization fears, the asset class benefits from record demand from a coalition of Western reserve managers. Treasuries are often historically studied as baseline instruments. However, for inflation-conscious macro observers, Treasuries carry currency and sanction risks that gold does not.
Conclusion
The 5-year data reveals an inflection point in global monetary architecture. US Treasury holdings have reached historic peaks even as the institutional buyers most critical to the dollar's reserve status—China, India, Brazil—have systematically exited. This paradox will likely resolve through one of two mechanisms: either Western central banks consolidate their holdings into a smaller but more concentrated base, or the bifurcated flows persist indefinitely, creating permanent structural demand from complementary constituencies.
Commodity markets have responded to these flows with notable divergence: precious metals have seen strong demand as safe-haven and structural reserve assets, while energy commodities have stagnated amid structural supply surplus. Indian equities, having shown historical resilience, have continued functioning as key instruments despite cyclical headwinds.
Looking forward, the key variable is the pace of de-dollarization acceleration. If geopolitical tensions escalate or new sanctions episodes occur, the Treasury selling and precious metals accumulation will likely intensify. Conversely, if de-escalation materializes, Treasury flows could stabilize and commodity price pressure could mount. For investors, the implication is clear: diversification across asset classes is essential, with particular overweighting toward precious metals for insurance and NIFTY 50 for long-term growth, while maintaining realistic valuations expectations and hedging against rupee depreciation risks.