
Loading
Market Intelligence › Market Intelligence
The annual return gap between Nifty 50 and Nifty Midcap 100, and the risk hidden in the average
Published by The Retail Trader · AUG 07, 2026 · Equities
During bull markets it is common to hear that midcaps and smallcaps are where the real returns are. The data supports only part of that story. We calculated calendar-year returns for Nifty 50 and Nifty Midcap 100 and plotted the gap.
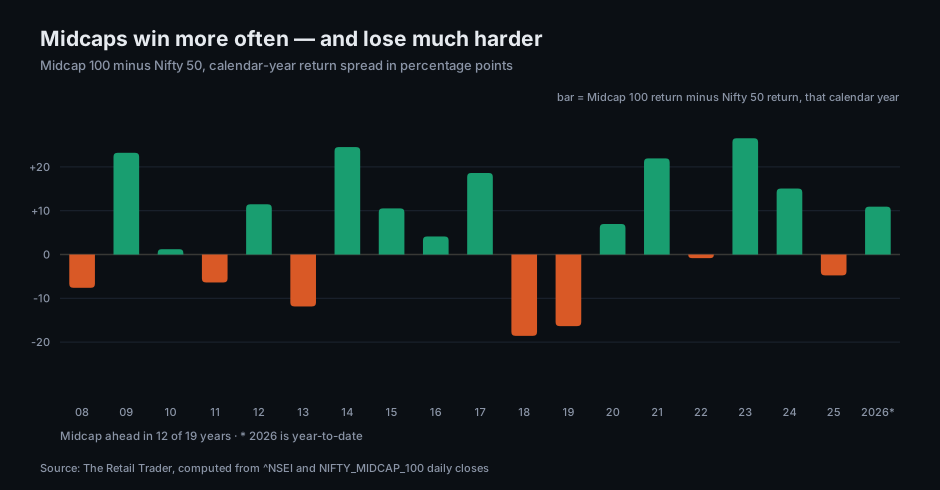
Midcap 100 outperformed Nifty 50 in 12 of the 19 calendar years shown, about 63%. Winning years could produce large gaps.
Some of the largest midcap advantages:
• 2023: 26.5 percentage points ahead of Nifty.
• 2014: 24.5 points ahead.
• 2009: 23.2 points ahead during the recovery after the crash.
• 2021: 21.9 points ahead.
Two difficult years arrived consecutively:
• 2018: midcaps lagged by 18.6 points. Nifty returned +3.15%, while Midcap 100 returned -15.42%.
• 2019: midcaps lagged by 16.4 points. Nifty returned +12.02%, while Midcap 100 returned -4.32%.
An investor entering midcaps near the 2017 peak then faced two years of watching the large-cap benchmark rise while midcaps fell. Such stretches can be difficult to remain invested through.
The spread chart extends sharply in both directions: around +23 points in 2009 and -19 points in 2018. Focusing only on the stronger years leaves out much of the experience.
A claim about higher long-term returns assumes the investor can withstand the weaker periods. Exiting after a stretch like 2018–19 can produce a very different outcome from the full-period record.
In 2026 through 24 July, Midcap 100 led Nifty 50 by about 10.9 points: Nifty was at -9.04%, versus +1.88% for Midcap 100. This outperformance during a declining market differed from 2008, 2011 and 2013, when midcaps lagged.
A partial year is not enough to establish a new pattern. The historical record illustrates that pursuing the midcap advantage also required tolerating substantial periods of underperformance.
All figures in this article were computed from The Retail Trader daily index database through 24 July 2026. Past performance does not indicate future performance. This analysis is educational only and is not a recommendation to buy or sell.