
Loading
Market Intelligence › Market Intelligence
Ranked 8 of the eight sectors · -36.2 points behind the Nifty · deepest fall inside the year -46.2%
Published by The Retail Trader · DEC 31, 2018 · Sector Analysis
In 2018 the Nifty Realty index returned -33.02% — eighth of the eight sectors. Over the same window the Nifty 50 returned +3.15%, so Realty delivered 36.2 percentage points less than the benchmark.
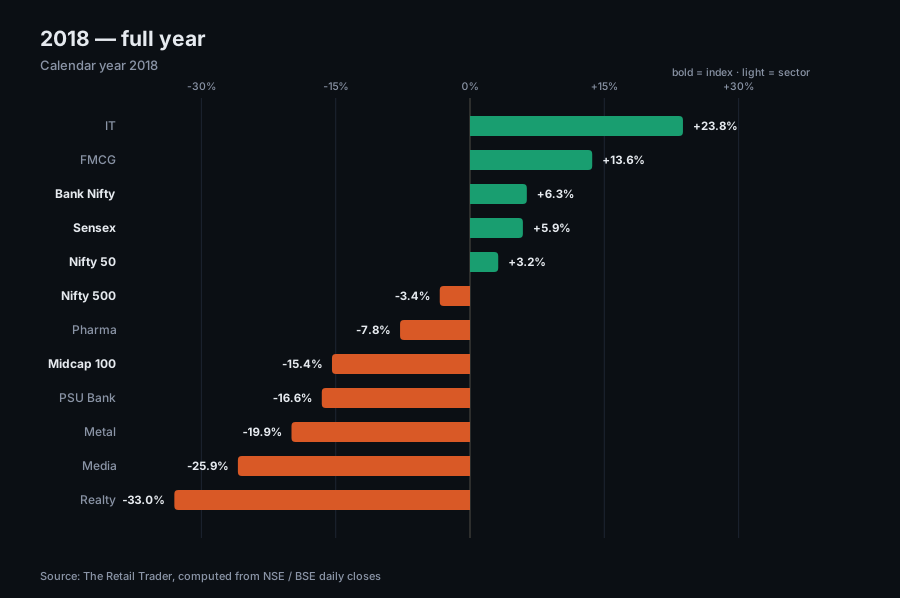
Sector ranking for 2018, best to worst:
• IT — +23.78%
• FMCG — +13.65%
• Bank — +6.35%
• Pharma — -7.81%
• PSU Bank — -16.55%
• Metal — -19.94%
• Media — -25.92%
• → Realty — -33.02%
A month-by-month account of 12 months — 5 of them positive:
• January — -0.63%
• February — -5.16%
• March — -10.05%
• April — +9.59%
• May — -8.47%
• June — -7.93%
• July — +0.48%
• August — +1.10%
• September — -20.39%
• October — -2.14%
• November — +7.96%
• December — +0.15%
The best month was April (+9.59%) and the worst September (-20.39%). There are 30.0 percentage points between the two, which shows how differently the year's net number was arrived at.
Within 2018, the deepest peak-to-trough fall in Realty was -46.2%. That is a different number from the one on show at the end of the year — a sector can close at -33.02% and still have been 46.2% down along the way, and it is in that decline that most people give up the position.
All figures in this article were computed from The Retail Trader daily index database through 24 July 2026. Past performance does not indicate future performance. This analysis is educational only and is not a recommendation to buy or sell.