
Loading
Market Intelligence › Market Intelligence
Fourteen consecutive-year comparisons across eight NSE sectors, and the risk of chasing the latest winner
Published by The Retail Trader · AUG 07, 2026 · Sector Analysis
A familiar mistake follows December: allocating to the sector that has just risen the most. We calculated the calendar-year returns of eight NSE sector indices from 2012 onward and found a result that challenges that habit.
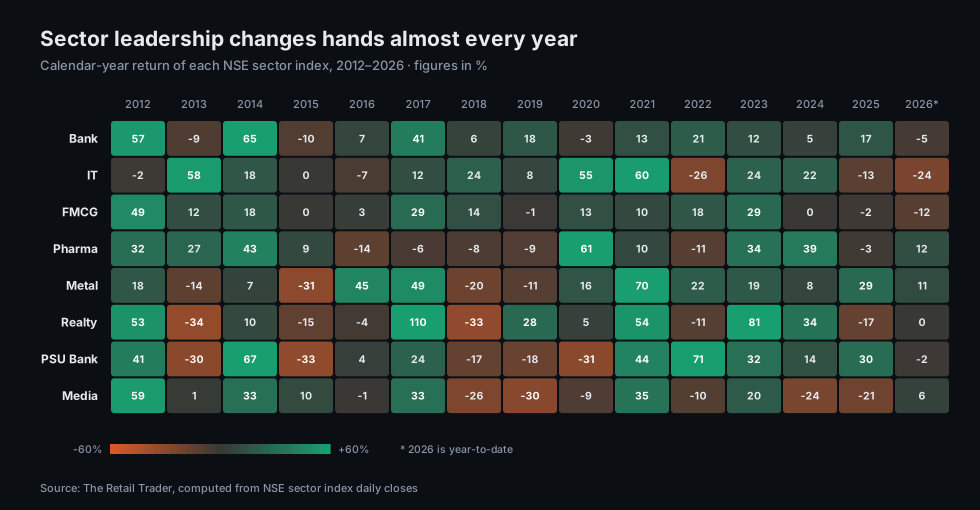
Across the 14 adjacent-year comparisons from 2012 to 2026, the sector leading one year did not lead the next. The 2026 figures are year-to-date, not a completed calendar year.
The sequence of leaders:
• 2012 Media (+59%) → 2013 IT (+58%) → 2014 PSU Bank (+67%) → 2015 Media (+10%).
• 2016 Metal (+45%) → 2017 Realty (+110%) → 2018 IT (+24%) → 2019 Realty (+28%).
• 2020 Pharma (+61%) → 2021 Metal (+70%) → 2022 PSU Bank (+71%) → 2023 Realty (+81%).
• 2024 Pharma (+39%) → 2025 PSU Bank (+30%) → 2026 Pharma (+12%, year-to-date).
Leadership returned to sectors such as Realty, PSU Bank and Pharma, each appearing three times, but never in consecutive years in this sample.
Some examples of rapidly changing performance:
• IT led in 2013 with +58% after lagging in 2012 at -2%. It later gained +60% in 2021 and was the worst performer in 2022 at -26%.
• Realty gained +110% in 2017, the largest annual result in the dataset, then lagged in 2018 at -33%.
• PSU Bank led in 2014 with +67%, then lagged in 2015 at -33%.
• Media led in 2012 at +59%, then repeatedly lagged in 2018, 2019, 2024 and 2025.
This is not a rule to sell last year’s winner. Fourteen comparisons are too few to establish such a trading rule.
The record shows that exceptional sector performance did not guarantee another year of leadership. A portfolio concentrated entirely in the latest winner is still a concentrated bet, however attractive the recent returns look.
The heatmap makes the dispersion visible. In 2026 through the dataset date, Pharma (+12%) and Metal (+11%) were positive while IT was down 24%, all in the same market.
For sector selection, concentration risk deserves as much attention as the direction of the overall market.
All figures in this article were computed from The Retail Trader daily index database through 24 July 2026. Past performance does not indicate future performance. This analysis is educational only and is not a recommendation to buy or sell.