
Loading
Nifty -2.40% · best IT +2.50% · worst Realty -10.06%
Published by The Retail Trader · JUN 28, 2013 · Monthly Audit
The June 2013 audit — what every major index and every sector did across the month's 20 sessions, all measured from the 2013-05-31 close to the 2013-06-28 close.
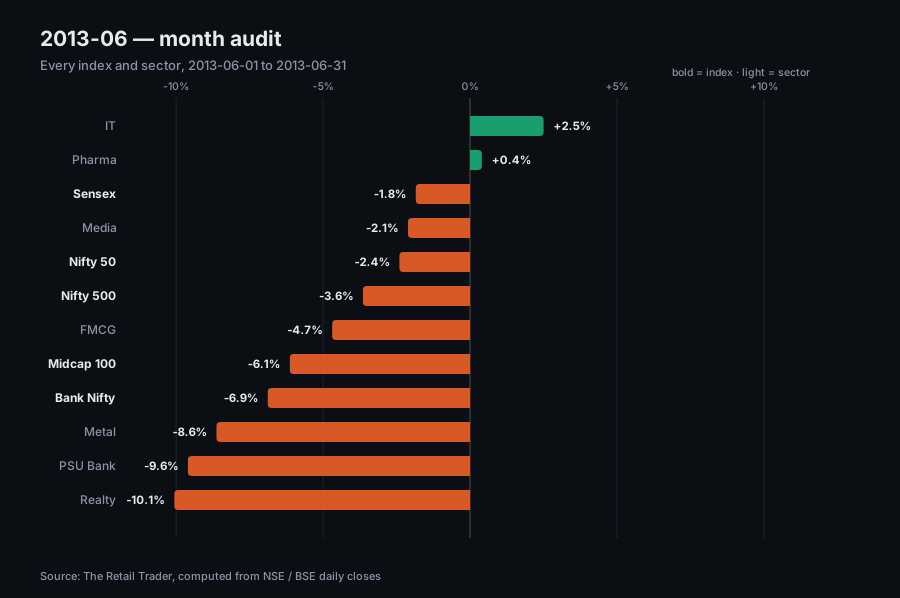
An account of 20 sessions, best to worst:
• Sensex — -1.84%, close 19395.81
• Nifty 50 — -2.40%, close 5842.20
• Nifty 500 — -3.64%, close 4510.90
• Midcap 100 — -6.13%, close 7342.40
• Bank Nifty — -6.88%, close 11617.25
Of the Nifty's 20 sessions, 8 were up and 12 down. The best day was 2013-06-28 (+2.81%), the worst 2013-06-20 (-2.86%). There were 3.7 points between the Midcap 100 and the Nifty — large caps were ahead of the broad market.
There were 12.6 percentage points between the best and the worst sector:
• IT — +2.50%
• Pharma — +0.40%
• Media — -2.11%
• FMCG — -4.69%
• Bank — -6.88%
• Metal — -8.63%
• PSU Bank — -9.60%
• Realty — -10.06%
India VIX ranged between 16.78 and 21.14 during the month and closed at 17.95. The deepest peak-to-trough fall in the Nifty inside the month was -5.9% — so despite the month's net number of -2.40%, a decline of that depth was seen along the way.
All figures in this article were computed from The Retail Trader daily index database through 24 July 2026. Past performance does not indicate future performance. This analysis is educational only and is not a recommendation to buy or sell.