
Loading
A 293-day decline, and Midcap's -65.4% — the biggest loss in the dataset
Published by The Retail Trader · OCT 27, 2008 · Case Studies
On 8 January 2008 the Nifty made its peak. On 27 October 2008 it made its trough. In between were 293 days and a loss of 59.9% — the biggest drawdown in our entire 19-year record, nearly double the second-largest.
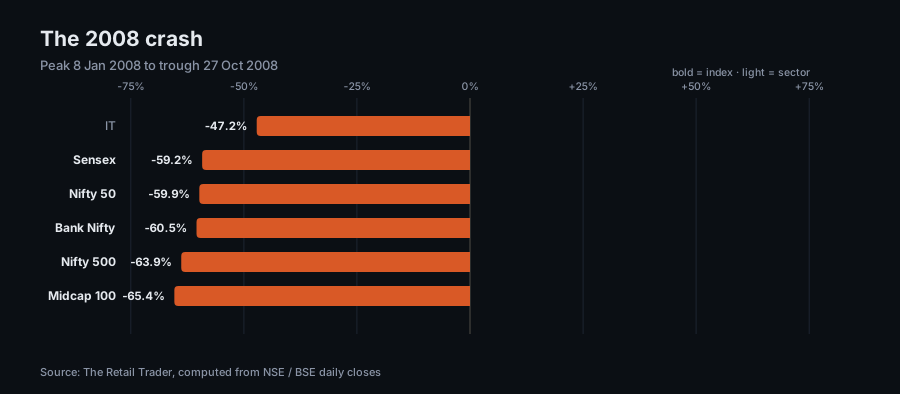
Peak to trough:
• IT — -47.2%, the smallest loss
• Sensex — -59.2%
• Nifty 50 — -59.9%
• Bank Nifty — -60.5%
• Nifty 500 — -63.9%
• Midcap 100 — -65.4%, the largest
The pattern is the same one seen in every big decline: the hotter and smaller-cap the basket, the greater the loss. The Midcap 100 lost 5.5 points more than the Nifty, and the Nifty 500 lost 4 points more.
After the trough, the Nifty took 743 days to touch its old peak — more than two years. The whole cycle, peak to peak, was 1,036 days.
Remember the arithmetic of recovery: after -59.9%, you need +149% to get back to the same place. And that is exactly what happened — from 28 October 2008 to 5 November 2010 the Nifty went up +148.9%.
From trough to old peak (Oct 2008 – Nov 2010):
• Bank Nifty — +222.1%
• Midcap 100 — +196.7%
• IT — +186.4%
• Nifty 500 — +162.0%
• Nifty 50 — +148.9%
• Sensex — +145.5%
Those that fell the most were the ones that bounced the most — Bank Nifty and the Midcap 100. But these are two different experiences: for someone who bought at the peak and held all the way, this was a 1,036-day round trip. For someone who bought near the trough, money grew two and a half times in two years. One chart, two completely different lives.
2008 is the outlier in our drawdown record — of the other nine episodes, eight are between 10% and 28%. That does not mean it will not happen again; it means that deciding position size by treating it as 'normal' is also wrong. In 2020, -38.4% came, and it came in 69 days, not 293 days.
All figures in this article are computed from The Retail Trader's own daily index database, as of 24 July 2026. Past performance is no indication of the future, and this analysis is for educational purposes only — it is not a buy or sell recommendation.