
Loading
-22.5% over 359 days, without any big single-day shock
Published by The Retail Trader · FEB 25, 2016 · Case Studies
The declines of 2008 and 2020 are remembered because they had big, frightening days. The decline of 2015-16 is remembered by no one — and it is the Nifty's third-biggest decline. From 3 March 2015 to 25 February 2016, -22.5% over 359 days.
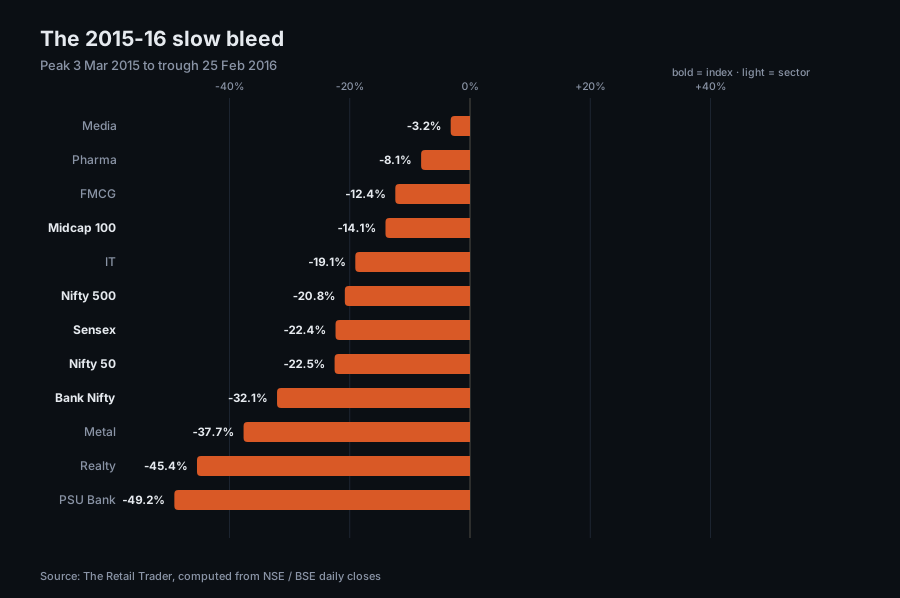
Peak to trough:
• Media — -3.2%, almost untouched
• Pharma — -8.1%
• FMCG — -12.4%
• Midcap 100 — -14.1%
• IT — -19.1%
• Nifty 500 — -20.8%
• Sensex — -22.4%
• Nifty 50 — -22.5%
• Bank Nifty — -32.1%
• Metal — -37.7%
• Realty — -45.4%
• PSU Bank — -49.2%
One unusual thing: the Midcap 100 (-14.1%) lost less than the Nifty (-22.5%). This is the opposite of every other big decline — in 2008 midcaps fell 5.5 points more, in COVID almost equal. 2015-16 was a largecap-led decline.
In our 'worst 20 days' list, this whole year has only one day. That is, the -22.5% loss was built up a little at a time, every day — there was no single day that made 'crash' headlines.
This is exactly why this kind of decline is the hardest. A crash has a clear trigger to exit. In a slow decline, each day is only slightly worse than the previous day, and 'it has already fallen a lot' feels true every week.
After the trough, it took 383 days to return to the old peak — the whole cycle 742 days. After 2008 (1,036 days) this is the second-longest cycle. That is, for more than two years the Nifty did not make a new high.
The current 2026 decline — -15.18% from the 2 January peak, not recovered as of 24 July — so far resembles 2015-16 in shape: no big crash day (the worst day was 19 March, -3.26%), and a decline spread out over months.
The difference is that in 2015-16 Bank Nifty and PSU Bank fell the most, whereas in 2026 IT (-24.1% year-to-date) is furthest behind and Pharma (+12.4%) furthest ahead. A similar shape, different leadership.
All figures in this article are computed from The Retail Trader's own daily index database, as of 24 July 2026. Past performance is no indication of the future, and this analysis is for educational purposes only — it is not a buy or sell recommendation.