
Loading
Over two years Nifty +15.6%, Midcap 100 -19.1% — a 35-point gap
Published by The Retail Trader · DEC 31, 2019 · Case Studies
2018 and 2019 were fine years at the headline level — the Nifty closed positive in both. Underneath that, for midcap investors, this was a two-year continuous bleed. This is the case study that best breaks the 'but the index is up' argument.
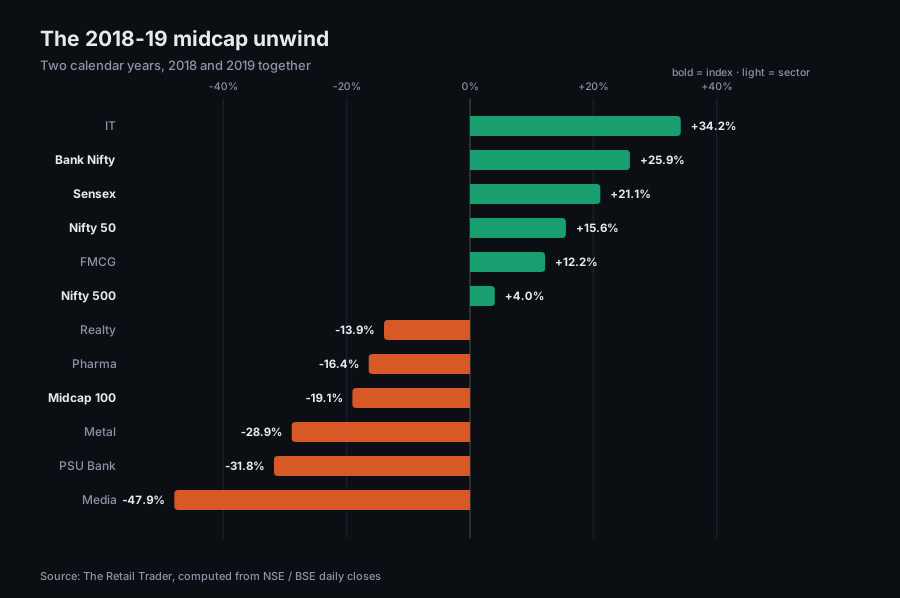
2018 and 2019 combined:
• IT — +34.2%
• Bank Nifty — +25.9%
• Sensex — +21.1%
• Nifty 50 — +15.6%
• FMCG — +12.2%
• Nifty 500 — +4.0%
• Realty — -13.9%
• Pharma — -16.4%
• Midcap 100 — -19.1%
• Metal — -28.9%
• PSU Bank — -31.8%
• Media — -47.9%
Nifty +15.6% and Midcap 100 -19.1% — a gap of 34.7 percentage points, in two years. In our midcap-vs-largecap record, 2018 (-18.6 points) and 2019 (-16.4 points) are the two worst consecutive years.
The Nifty 500 was only +4.0% over two years while the Nifty 50 was +15.6%. The Nifty 500 has 500 companies; its lagging the Nifty by so much shows that the gains had narrowed into a very few big names.
This is what is called a breadth collapse: the index rises because its top 10-15 stocks are rising, while hundreds of stocks below are falling. The screen says 'market at all-time high' and the portfolio is red.
To understand this, it is necessary to look at 2017: that year Realty was +109.8% (the biggest sector year in the whole dataset) and the Midcap 100 was 18.6 points ahead of the Nifty. 2018-19 was the reverse side of the same coin.
The 2017 leaders and how they did over the next two years:
• Realty — +109.8% in 2017, -13.9% in 2018-19
• Metal — +48.5% in 2017, -28.9% in 2018-19
• PSU Bank — +24.1% in 2017, -31.8% in 2018-19
• Media — +32.7% in 2017, -47.9% in 2018-19
All four out of four reversed. The pattern from our sector rotation study — that leadership does not last consecutively — showed up here in its most expensive form.
All figures in this article are computed from The Retail Trader's own daily index database, as of 24 July 2026. Past performance is no indication of the future, and this analysis is for educational purposes only — it is not a buy or sell recommendation.