
Loading
A seven-month account — from IT -24.1% to Pharma +12.4%, a 36-point spread
Published by The Retail Trader · JUL 24, 2026 · Performance Review
The full account of the first seven months of 2026, from the 31 December 2025 close to 24 July 2026. In one line: largecaps fell, midcaps did not, and at the sector level the year split into two completely different parts.
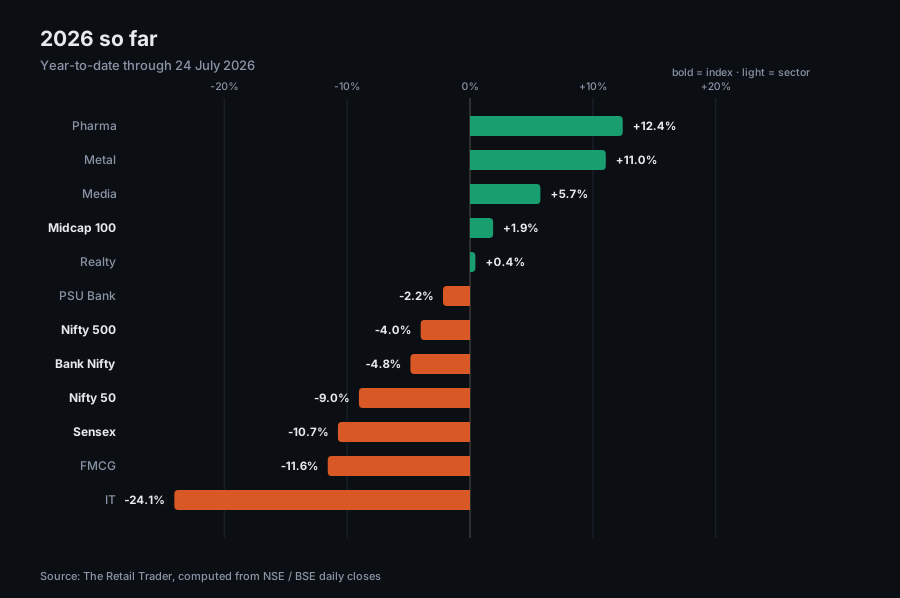
Year-to-date:
• Midcap 100 — +1.88%. The only positive index.
• Nifty 500 — -4.01%
• Bank Nifty — -4.85%
• Nifty 50 — -9.04%
• Sensex — -10.75%
There is a 10.9 percentage point gap between the Nifty and Midcap. In our midcap-vs-largecap study, midcaps were ahead in 12 of 19 years — but the key point is that this lead usually came in rising markets. Midcaps leading is less common in a falling year: in the falling years of 2008, 2011 and 2013, midcaps were behind the Nifty.
Year-to-date:
• Pharma — +12.4%
• Metal — +11.0%
• Media — +5.7%
• Realty — +0.4%
• PSU Bank — -2.2%
• Bank — -4.8%
• FMCG — -11.6%
• IT — -24.1%
IT's -24.1% is the biggest loss of the year, and a large part of it came in a single month — -19.5% in February. Pharma's +12.4% is the other side; the gap between the two is 36.5 percentage points.
Nifty month by month:
• January -3.10% · February -0.56% · March -11.31%
• April +7.46% · May -1.87% · June +1.35% · July (to the 24th) -0.41%
The whole year is in two parts: a -14.3% patch through March, and a +6.4% recovery after that. The net -9.04% to date is the sum of the two.
From the 2 January 2026 peak, the Nifty reached -15.18% on 30 March, and as of 24 July that peak has not been regained. In our drawdown record this is the tenth 10%+ episode since 2007 — in the middle of the list by depth, very close to the -15.77% of 2024-25.
All figures in this article are computed from The Retail Trader's own daily index database, as of 24 July 2026. Past performance is no indication of the future, and this analysis is for educational purposes only — it is not a buy or sell recommendation.